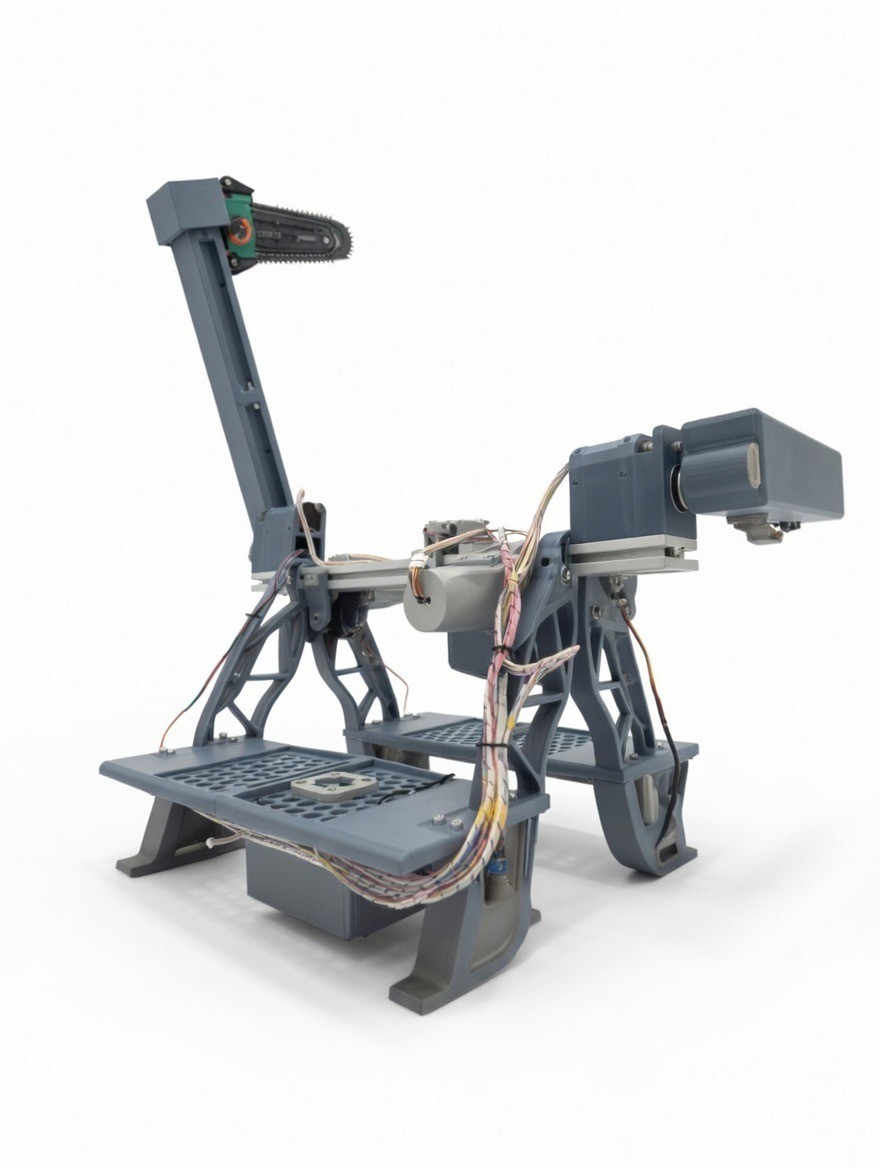
Branch detection
image processing
Autonomous cutting
with robotic arm


Pause
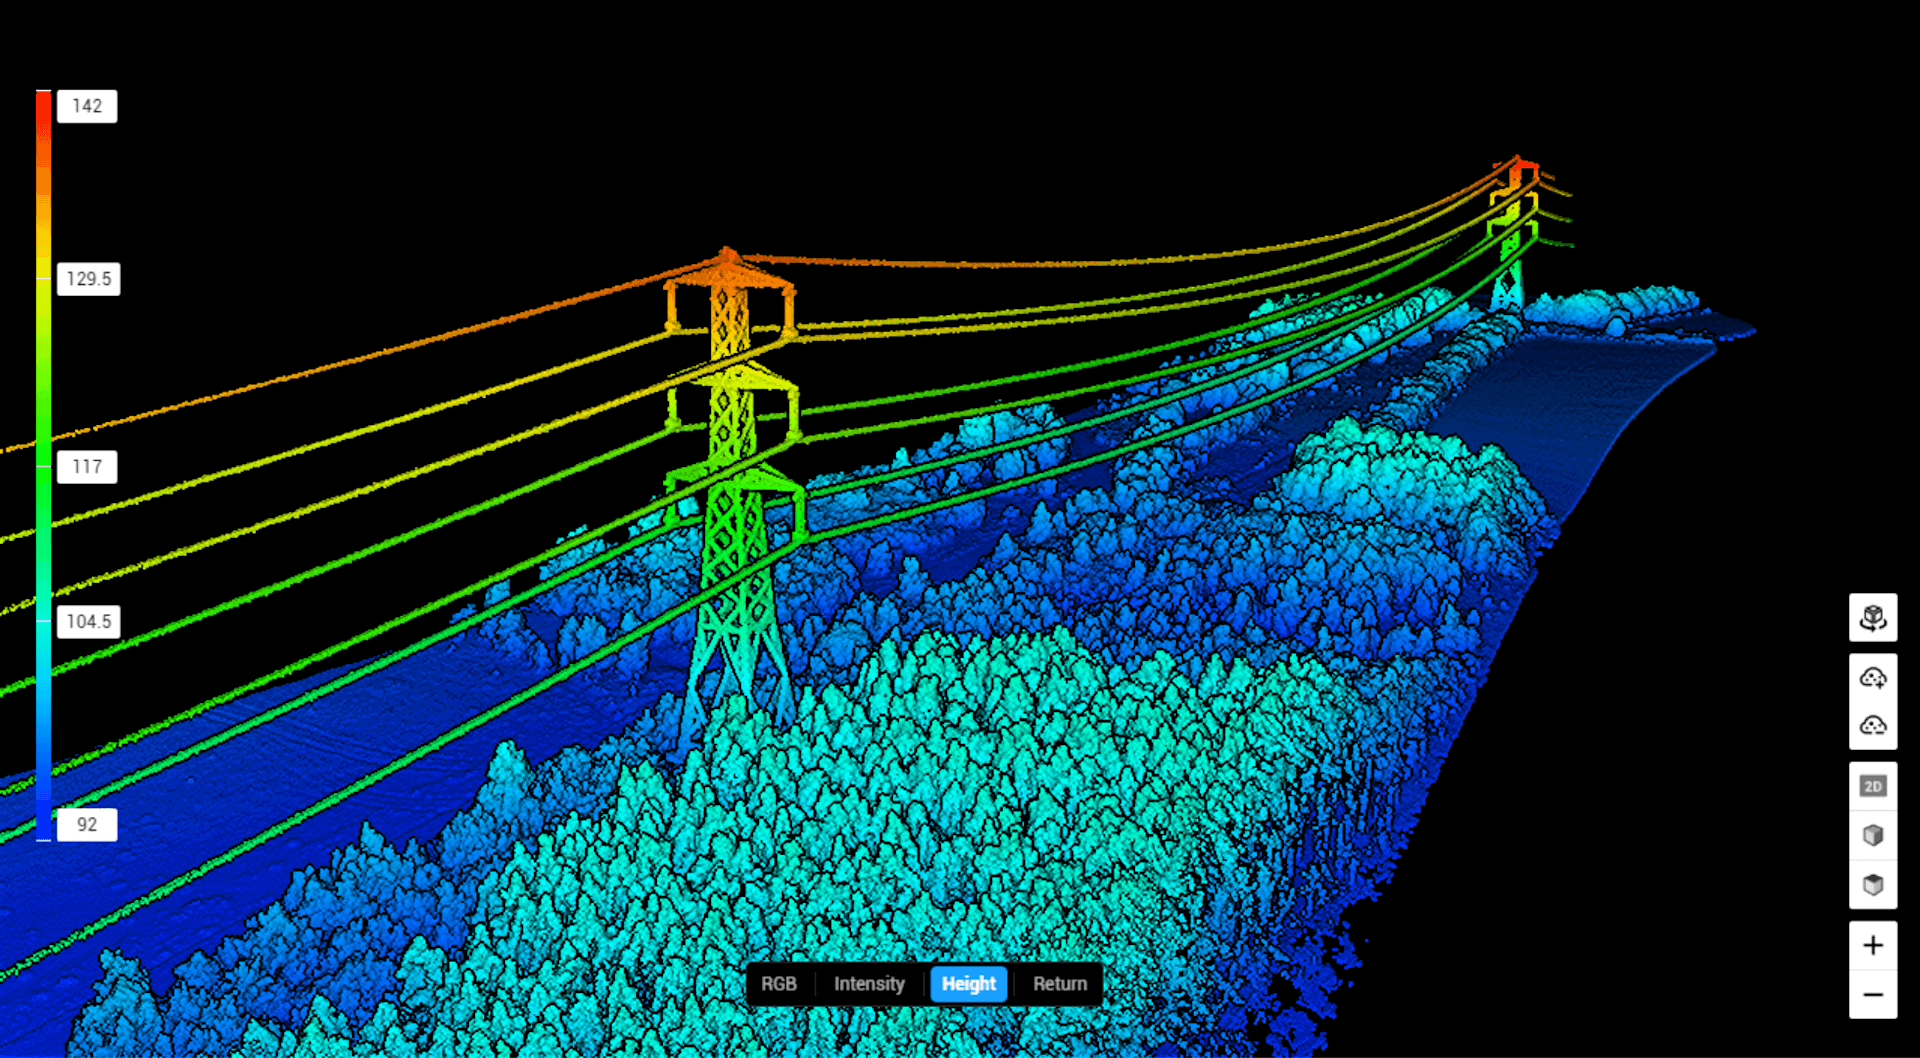
LiDAR Point Cloud Visualization
A high-resolution LiDAR scan showcasing terrain, vegetation, and infrastructure through color-coded point cloud data.
Classified Utility Lines
Red and green vector lines indicate mapped power transmission lines or railway paths.
Detailed 3D Structures
Poles, wires, and tree geometries are clearly distinguishable in 3D.
Color-Coded Point Cloud Data
Each point is visualized with a color scale for easier interpretation of terrain and objects.
Ground Surface Detection
Blue tones highlight road or terrain surfaces.
Vegetation & High Object Mapping
Green and yellow tones represent trees, foliage, and other elevated structures.
Pause
What tasks can Lineer’s robotic system perform?
Can the system work on energized (live) lines?
How fast does the robot move?
How is the robot positioned on the wire?
Is it compatible with different wire thicknesses?
How does the modular system work?
What’s the capacity for ice breaking?
How robust is the system under weather conditions?
What are the deployment times compared to manual methods?